New infographics
We have rolled up the existing Radar, Graph-it and Countries charts under a new link in the center-panel grid named 'Infographics' to make room for new summary tables - 'SWOT' and 'Influences'. These are described below:
.PNG)
New visualizations
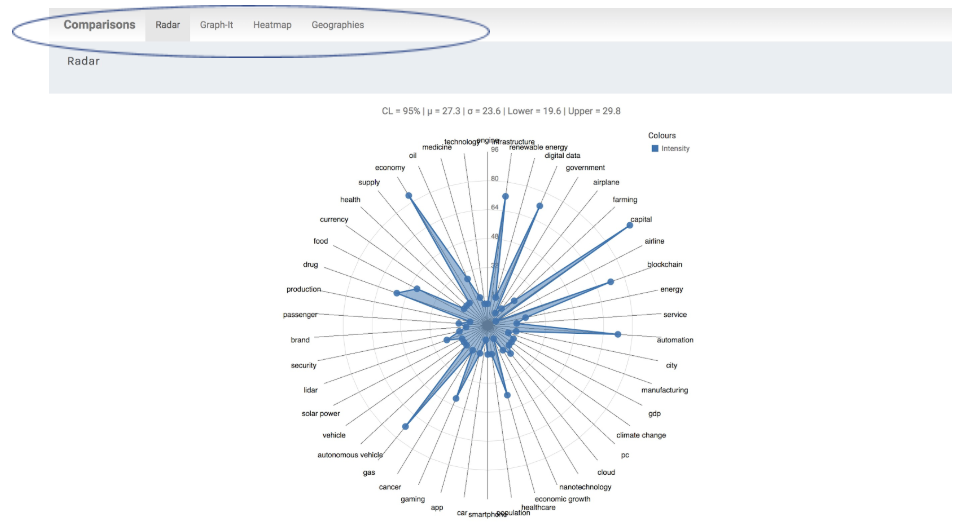
Tabbed access to existing and new Infographics reduces the time it will take you to switch views here between the Radar, Graph-it, Heatmap and Geographies charts, which all operate with similar controls.
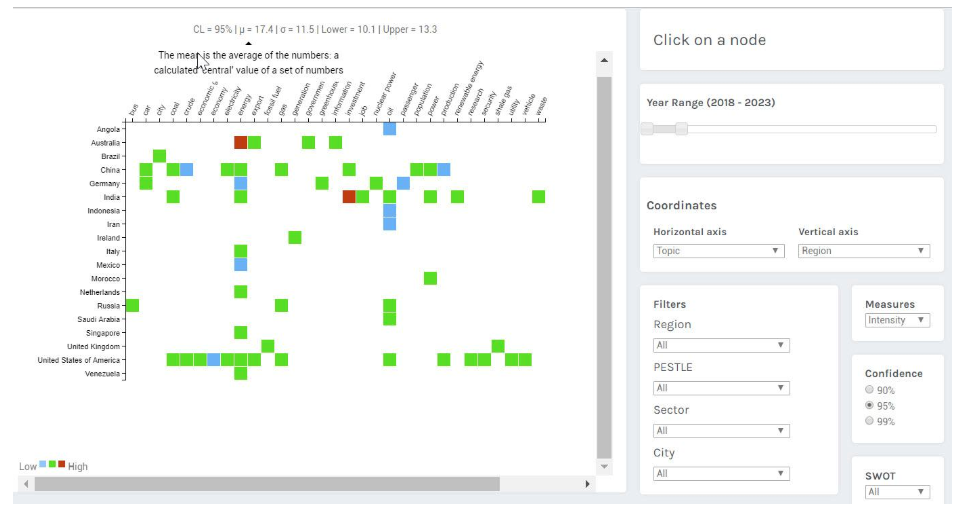
Heat Map
The new Heat map compares sectors, topics, regions, PESTLE and cities in matrix form showing the intensity of one against another for quick identification of emerging change. Clicking the titles shows passive and active sums of the rows and columns. Clicking the nodes shows details.
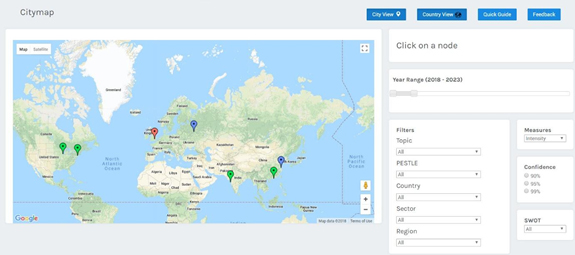
Geographies
We are also now capturing the top 150 city names based on population from individual forecasts to track emerging change happening in top conurbations. You can again find the subsequent analysis under Export All in the top grid and it will appear as part of the Excel spreadsheet. Both the 'City View' and 'Country View' appear beneath the Geographies tab in Infographics.
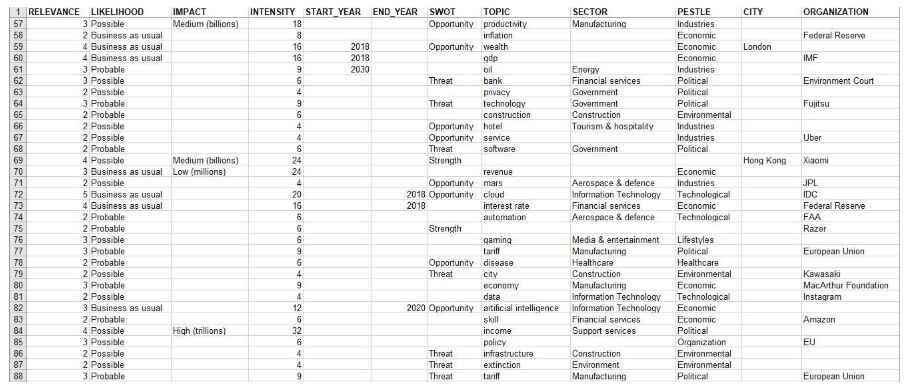
SWOT (Beta)
We are experimenting with automatically differentiating Forecasts by a new Strength, Weakness, Opportunity or Threat criteria. You can find the subsequent analysis under Export All in the Grid and it will appear as part of the Excel spreadsheet (see Organizations below). 'SWOT' also appears as a drop-down in the above visualizations as well as the Graph-it chart. The center-panel grid identifies the latest SWOTs in tabular format:
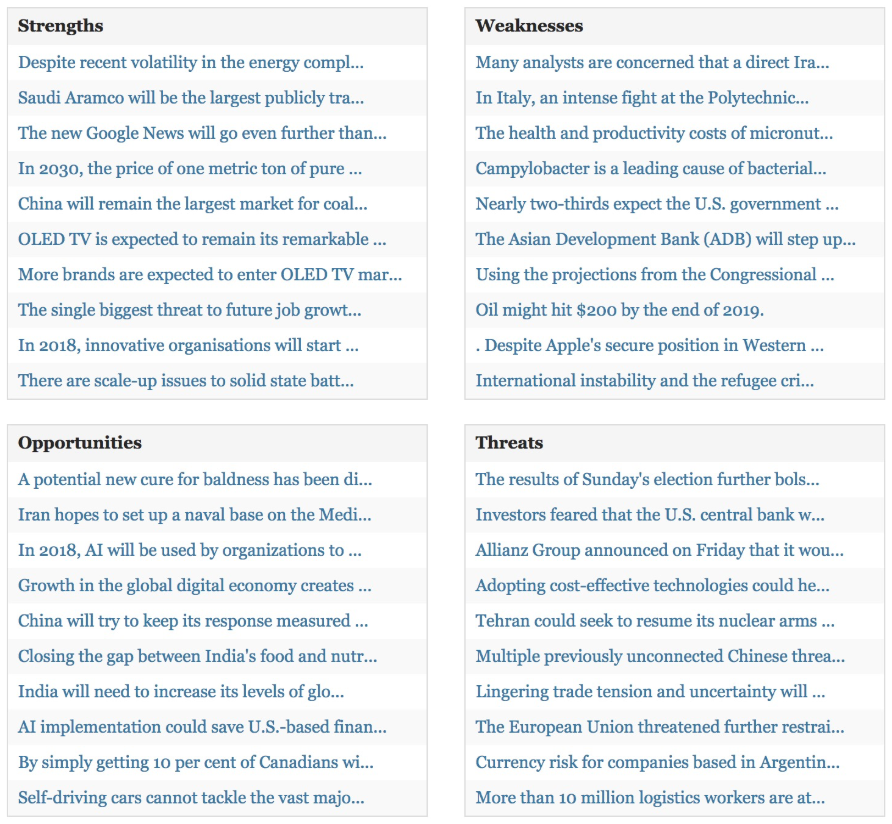
Hovering your mouse over each will quickly reveal the full forecast and clicking on each will take you to the Insight.
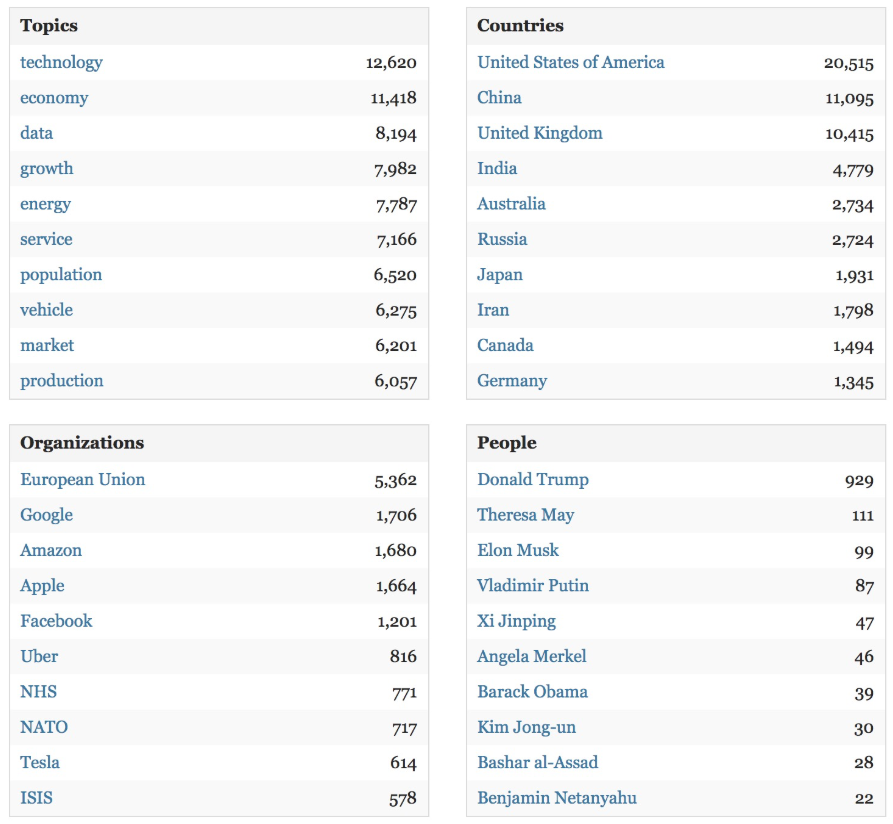
Influences
In the same tabular format, we are now identifying the top topics, countries, organizations and people impacted by, or causing emerging change in the center-panel grid under 'Influences'. Maybe a few mis-spells, duplicates and missing 'Influences' in this first version. We are working to clean them up.
Spline Charts
You can now compare one city, country, region, PESTLE criteria, sector etc to another using the new discrete, not curve-based, spline chart capability. Full details to use this are in the Help section of the Graph-it guide.
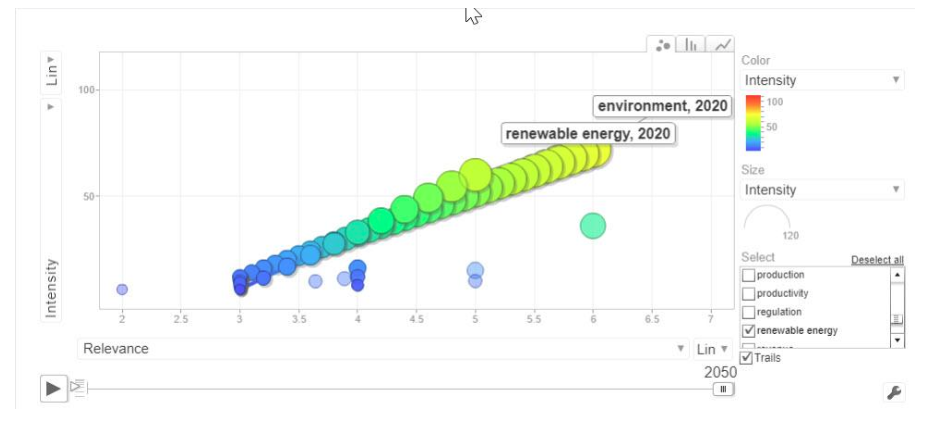
In the example above, the environment and renewable energy follow almost identical forward tracks but with less relevance and intensity in the future compared to other global issues.
Organizations
We are now collecting names of organizations making, or potentially being influenced by emerging change and mentioned in individual forecasts, currently (17,500 as of 5 May).
Plans are in place to capture previously unmentioned new organizations going forward. You can find the subsequent analysis under Export All in the top grid and it will appear as part of the excel spreadsheet. 'Organizations' also appears in Refine to help you conduct competitive intelligence.
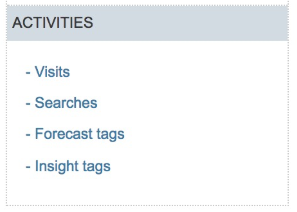
Activities
We have added a new section to the bottom of the left-hand navigation menu labelled ACTIVITIES. Here you will find a record of the things you've looked at (Visits) and a new 'Searches' page which shows a history of what you've searched on. We have moved the 'Forecast tags' and 'Insight tags' pages into this section.
Pie chart – start dates
We are now showing the first year published on Shaping Tomorrow instead of the author's suggested Start Date.
Sorting default
We have changed the default sorting of all forecasts to Publication rather than Added Date.
Athena's data extraction
We are increasing relevant sources at a phenomenal rate thanks to our members and clients and improving Athena's data extraction and self-learning capabilities. This release has improved data extraction by a further 15%. More to come here.
GDPR
We welcome the new EU GDPR regulations that will come into being on 25 May. The regulations have little impact on our service to you. That's because we have had similar GDPR privacy policies in place for over a decade.
We have made minor modifications to our database to be in line with regulations. For instance, we now only collect date of births instead of birthdays.
What's Next?
We will be updating our privacy policy in the next two weeks to align with GDPR. Expect to also see new cross-Impact, cloud analysis and a future cone representation in the next release, due in a couple of months, after we have taken time out to upgrade our underlying software.
We'll be having our annual strategy meeting with the team in June. Expect a lot of new developments after that meeting including even greater machine learning, more powerful visualisations, chatbot and search development and further improvements in the immediacy of response to your queries.
Happy futuring,
The Shaping Tomorrow team